


Gdzie jesteśmy z euro/usd?
Thats the authorial approach for market analysis.
I hope you enjoyed it. Its easy to understand and implementing it at your investing.
Let’s make analysis based on daily quotations.
Its taken last 400 days for euro/usd bahaviour. Let’s take a look for a data:
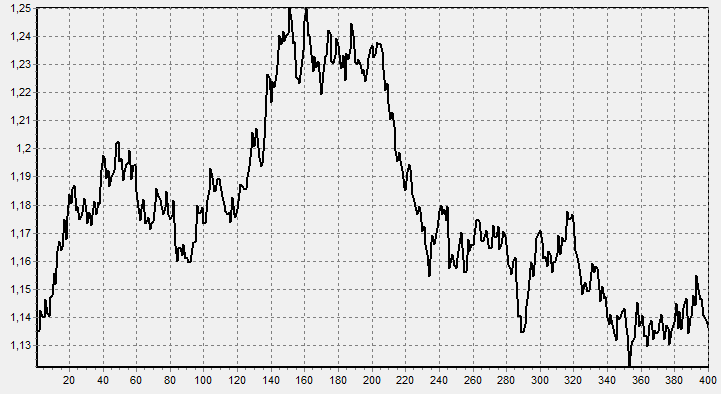
photo1. Euro/usd last 400 days - global view (newhach's graph)
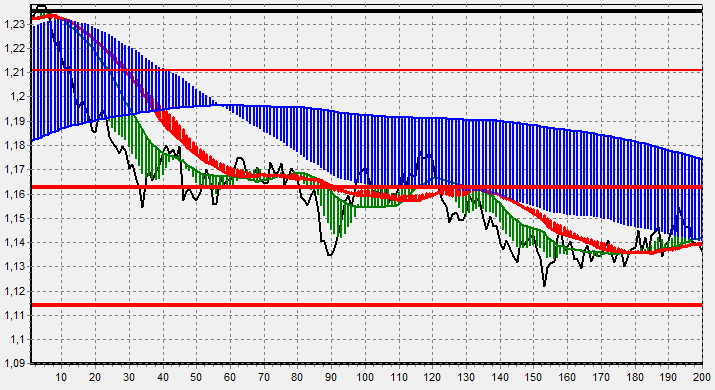
photo2: Graphical ilustration of Euro/Usd (last 200 days) ( newhach's interpretation)
Whats of interpretation of it?
1. blue area – type of global market trend (decreasing: arms directed down; growing up: arms directed up)
2. red line (red river) – the signal line
3. green line – adjuvant line
4. red border horizontal lines – support & resistance lines
5. black line – actual rate of euro/usd
How to interpret this:
- red river line keeps under the blue armes directed down: bears are on the market in the long period;
- red river line keeps over the blue armes directed up: its the bulls market in the long period;
- green line keeps under the red river line : bears are on the market in the short period;
- green line keeps over the red river line: its the bulls market in the short period;
where we are at euro/usd?
- bears are on the market now: red river is under the blue arms;
- actual euro/usd rate to rebound the resistance point: red river line and blue lines are almost touching each other (bear market);
- the nearest support place is 1.115
- be aware that the variability of actual rate will speed up in next week (bears are coming ) – be prepared.
in next post you will get:
- the hints for gold behaviour;


Good article! Professional financial analysis. Hope new articles coming soon.