ZŁOTO w decydującym punkcie!
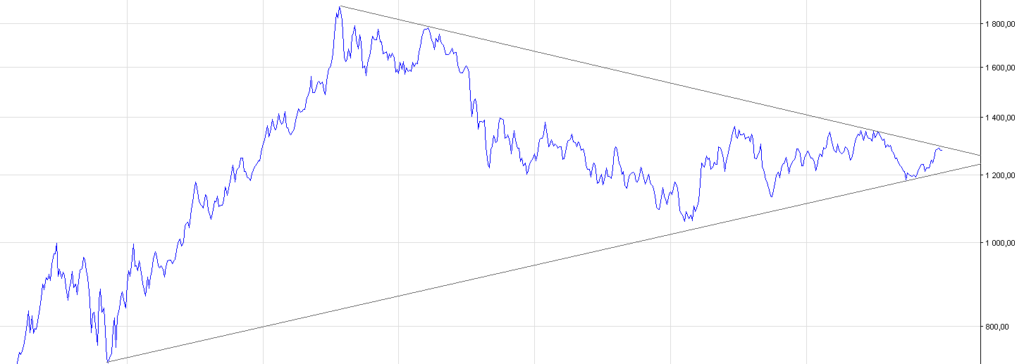
Lets take a look for the gold chart in the weekly basis – photo1. There is a beauty big triangle almost ending its formation.
Based on the global market behaviour its a big chance to get the gold’s rate out of triangle from the upper side.
If that scenario realized the potential range of growth is up to 2300 usd ( 80% of potential profit from the current price).
photo 1. The gold quotation – weekly basis.
Whats the graphical interpretation of current rate of gold – analysis based on authorial newhach’s indicators:
- weekly interpretation:
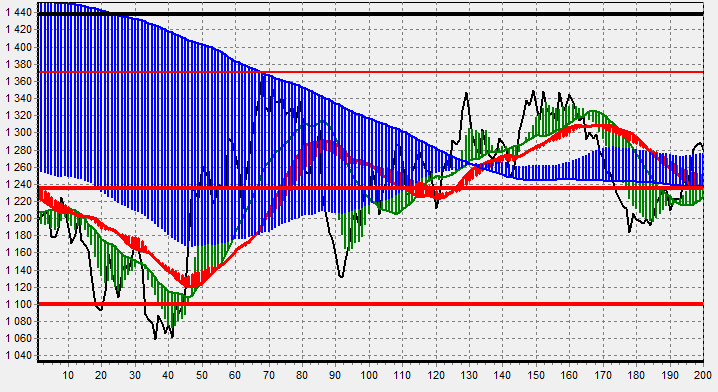
photo2: gold on weekly basis – last 200 sesions – global view
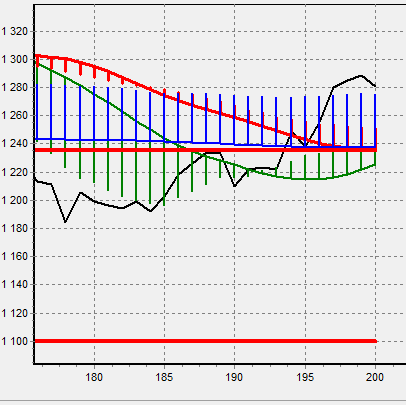
photo3: gold on weekly basis – last 25 sesions. The gold at the bottom suport.
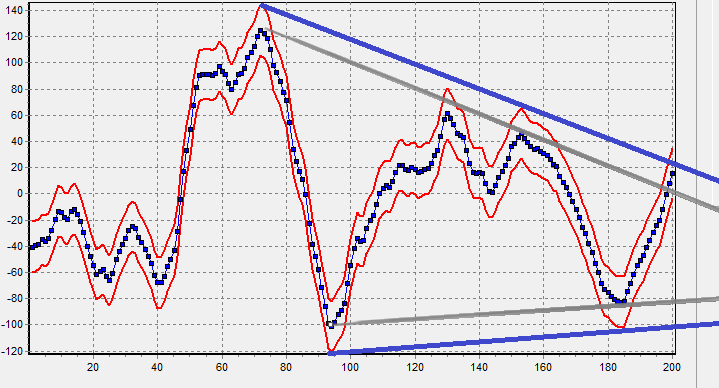
photo 4. newhach’s indicator – weekly basis. Gold rate get out of the resistance level – buy signal.
Conlusions:
- Actual support value in the growing trend for gold is 1230usd level;
- Actual rate of gold is above it – bull’s market (photo3)
- The actual resistance level is 1300usd (photo 1)
- The further resistance level is 1370 usd (photo 2)
- Actual signal at weekly basis is “buy” -( photo 4).


