DAX changing market points forecasting based on Carolan’s theory
In the analysis, we will rely on determining turning points for the DAX index in monthly (unconventional) and daily (traditional Carolan windows). In the monthly approach, we assume that a prerequisite for the occurrence of a cluster of dates Carolan’s window will be a system of dates, where only the same dates with the accuracy of a month can form a cluster of Carolan’s dates.
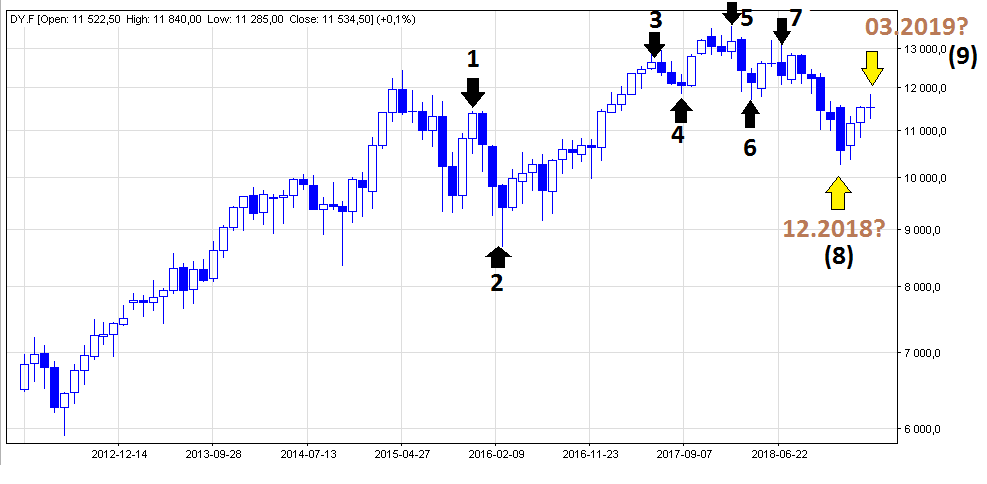
Figure 1 shows the DAX index chart on a monthly basis with the points taken for analysis (points 1 – 7).

In Table 1, the key dates (Fn) based on the spiral calendar were calculated for the defined turning points from the past.

Legend:
top, bottom – the turning point is defined on the basis of the top (top) or bottom (bottom),
point nr – the sequence number of the defined turning point,
odd / even – information about the date created on the basis of the next word of the sequence of even (even) and odd (even) ,
fn – the sequence number of the word of the fibonacci string,
months – elapse of time (in months) from a defined turning point calculated on the basis of a spiral calendar,
data in the table – is a set of calculated dates (month, year) based on a spiral calendar.
For such a set of dates, now we should designate their common part in order to find a Carolan’s window. Based on Carolan’s theory, the window will be the stronger the common data will be created on the basis of words of the same type, for example even or odd dates only. If the data comes from both strings, the window becomes weaker.
In table 1, common dates (month.year) are marked with the same colors. Therefore, the set of turning points in 2019 and also for parts of the past year 2018 is as follows:
02.2018, 05.2018, 08.2018, 10.2018, 12.2018;
01.2019 (even / even),
03.2019 (even / odd / odd),
05.2019 (even / odd / odd),
08.2019 (from / even),
11.2019 (from / even).
Based on the above dates, we can see one selected for the window Carolan’s December 12.2018 (odd / odd), i.e. point 8 from chart 1, perfectly proved to be the bottom of the course. What is waiting for us in 2019?
Well, the next calculated turning point is March 2019 (odd / odd / point 9), will it actually turn out to be the next turning point on the German stock exchange index, or will it be the peak? We’ll see … ..
And now we will conduct another analysis of the turning points of the German stock exchange, this time based on data from the daily (classic) daily Carolan’s. Table 2 presents dates calculated on the basis of a spiral calendar. The analysis covered the period of dates from the years of 06.2018 – 03.2019.

For such a set of dates, it is now necessary to designate their common part in order to find Carolan’s day windows. So, let us group the data in such a way that the date for each subsequent month is placed in the next row – table3.

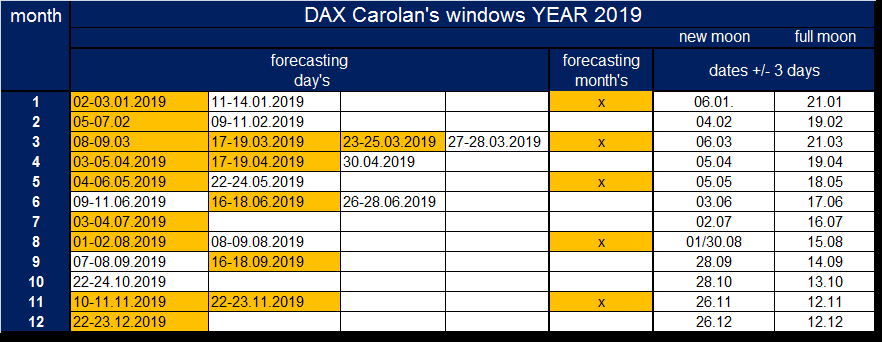
The list of Carolan’s windows for 2019 based on the dates from table 3, looks like:
02/03/01/2019; 11-14.01.2019
05-07.02; 09-11.02.2019
08-09.03; 17-19.03.2019; 23-25.03.2019; 27-28.03.2019;
03-05.04.2019; 17-19.04.2019; 30/04/2019;
04-06.05.2019; 22-24.05.2019;
09-11.06.2019; 16-18.06.2019; 26-28.06.2019;
03-04.07.2019;
01-02.08.2019; 08-09.08.2019;
07-08.09.2019; 16-18.09.2019
22-24.10.2019;
10-11.11.2019; 22-23.11.2019;
22-23.12.2019;
Which dates will turn out to be crucial, but the best and most effective forecasts are given by dates correlated additionally with the lunar calendar. Let’s check, therefore, which dates mentioned above fit into the new moon and full moon period – Table 4. Orange color correlates the +/- 3 days correlated dates with the moon phases, what’s interesting is nearly 60% of all dates, and key months relevant for trend changes market.


