
Investment strategy based on divine proportions on the example of DAX futures DY.F
Dear reader,
Do you remember what is the divine proportion and what properties characterize the fibonacci sequence? If I do not refer you to the article https://newhach.eu/teoria-carolana-wlasciwosci-ciagu-fibonacciego-kalendarz-spiralny-okienka-carolana/For the record, in the natural numbers the first two words of the string are equal to 1 and each next word (called the Fibonacci number) is formed as the sum of the two previous ones, i.e. 1 + 1 = 2; 1 + 2 = 3; 2 + 3 = 5; 3 + 5 = 8 etc. up to infinity: 1, 1, 2, 3, 5, 8, 13, 21, 34, 55, 89, 144, 233, 377, 610, 987 …
If we divide by ourselves any two words of the Fibonacci sequence, e.g. 987: 610; 89: 55, the ratio of these numbers will always be equal to the same number, equal to approximately 1.618. The larger the words of the sequence are divided, the more accurate the approximation of this number will be obtained. This number is called the “golden number” and means the Greek letter φ (pronounced “fi”). The ratio of this division is also referred to as the “golden ratio” or “divine proportion”.
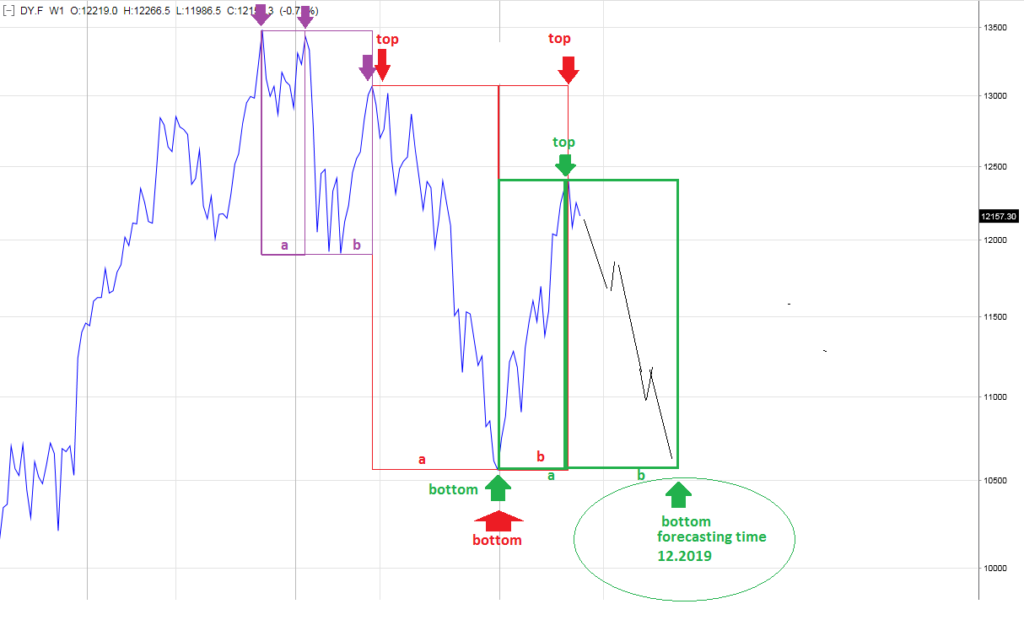
Figure 1 shows the DAX futures chart on a weekly scale with gold divisions marked. The golden division or gold sequence is the quotient of two sections a and b, which are proportions b / a = 1.618.
In order to determine the zloty division, we must know the length of the first segment a or b. For example, knowing the historical values of the 2 peaks or the top and the hole, the next turning point of the market (end of section b) will be calculated from the proportion: b = 1.618 x a. exemplary golden sequences on the DY.F. chart Interestingly, please see how ideally they fit into the next peaks and holes. Could this be the case? Probably not.
Please pay attention to the meaning of the red proportion (Fig. 1). It finishes exactly on 06/05/2019, marking the top and creating the foundations (green section “a”) for the next proportion in time (green). The end of this sequence designated at the end of 2019 !. If the May peak we have a considerable period of decline behind us !.
And now let’s look at DAX futures in a shorter period (Figure 2) and a 4-hour approach. On this basis, we will create an investment strategy based on catching peaks in time. The game is not about finding a specific index value but about finding a good moment to enter the market.
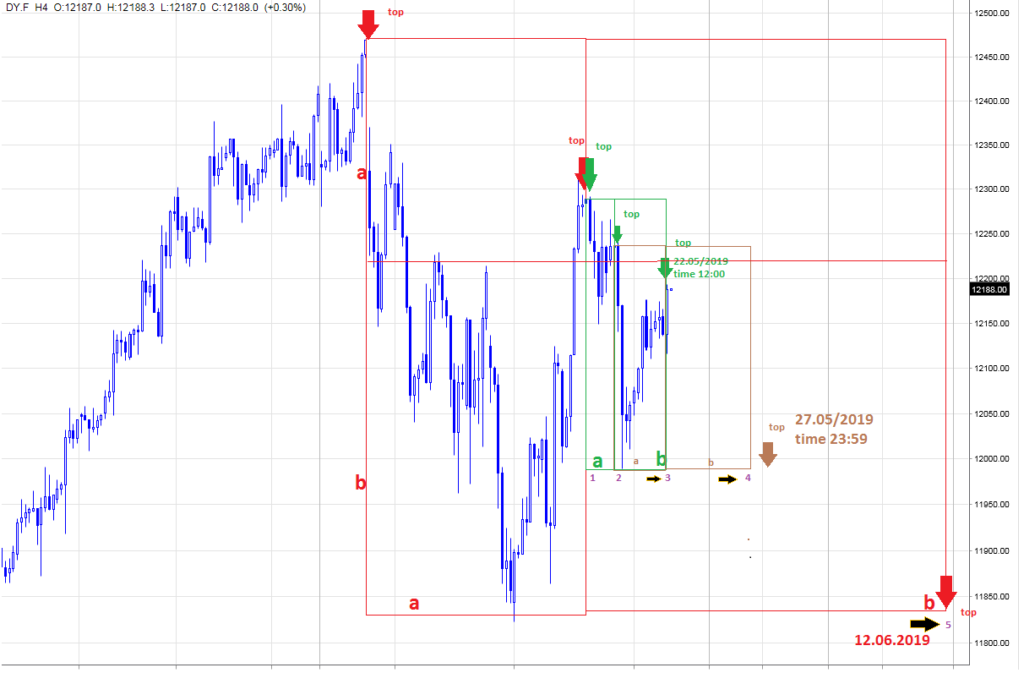
The key moment of entering the market is entering the market at the end of the gold sequence a + b. So let’s look at the green aspect ratio. Today on 22.05 at 12: 00 (I am writing this article) the formation has finished (end of “b”) creating a peak in the area of 12 188 pts, thus creating a good moment for taking a short position. Will the rightness of this theory prove to be effective, we will see …
In the same way, another peak can be determined in time (see the brown rectangle from Fig.2.). This formation will end on 27.05 at midnight, as a potential peak before the next fall).
I hope that you were interested in a bit of charm and the charm of “divine proportions”, and the theory contained here will allow you to build your own and effective investment strategies.