


Finished spiral on the S & P500 American stock exchange, returning inheritance !!!
Dear reader,
Recently, I have spent some time studying the issues closely related to Carolin’s theory based on fibonacci numbers and the spiral calendar. As you probably already know, the main advantage of the spiral calendar is the possibility of finding potential changes in the market trend based on the so-called Carolan’s windows. The problem is how do you know which windows (dates) will be crucial? Well, a tool such as a fibonacci spiral is based on the division of a straight segment into two parts in such a way that their quotient is 1,618 (see the Carolan theory – spiral calendar part 3. “Properties of the fibonacci sequence” in the Education section). The feature of every spiral is the fact that it is the end of the existing trend.
If we already know what is the golden ratio and divine proportion, then we will start to draw such a spiral for the S & P500 American stock market index (Figure 1). As a basis point, two key tops of the index were taken (08.2000 and 10.2007). Based on the properties of the spiral, we calculate the end of the spiral in time and for the price value (x and y axis).
The results are thus shaped as follows:
- x axis (target range of the end of the spiral): 05.20019!
- y axis (price range of the spiral): approx. 2980pts!
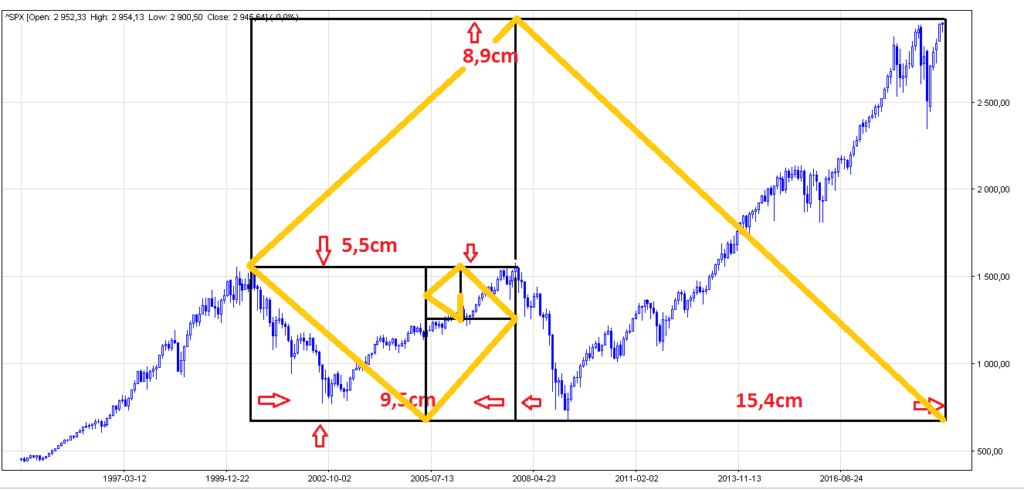
Based on the obtained data, we can expect to start a dynamic correction in 05.2019. Time, therefore, for the return of the teddy bear to the game. Interestingly, let’s look at the Carolan’s window for the S & P 500 index for 2018 (see the article: “The strategy of investing based on the Carolan window for the S & P 500 US stock exchange”).
Carolan’s windows S & P500 index: 01-02.2018; 07-09.2018; 01.2019; 04/05/2019 – picture 2.
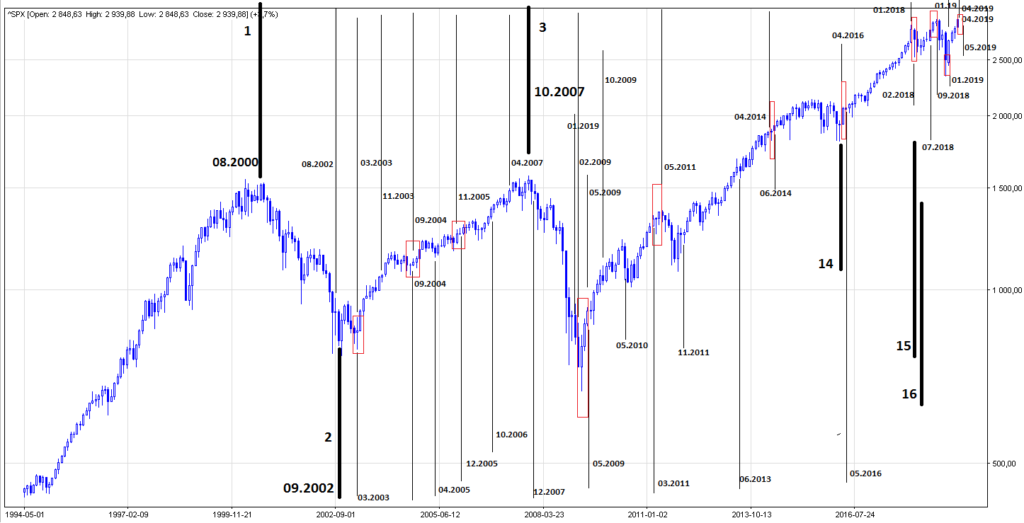
Upper listed dates are therefore the key dates of the Carolan’s windows, the dates of the three S&P500 indium tops constituting the basis for the triple peak. What is important 04-05-2019 is the current window with a large spiral window !.
In my opinion, the global stock markets will begin in May with a very strong and dynamic correction for stocks and commodities (see article: Determining the turning points on the CL.F oil index based on Carolan’s theory).
PS.
I am happy to listen to your opinion on the Carolan theory and the spiral calendar.
What do you think about this method? it’s useful, or maybe you think it’s a myth and nothing worth cheating.
I am waiting for feedback in the forum.
Best wishes and good luck in investments.
Newhach.