

S&P 500 index analysis based on Carolan’s spiral calendar
Dear reader,
In this article, we will set future turning points for the American stock exchange, as well as check the effectiveness of these forecasts for points from the past based on the Carolan’s theory and the spiral calendar. We will check if Carolan’s theory so seldom used by current market analysts is a kind of alternative to traditional AT technical analysis, and maybe even ahead of it in terms of simplicity and accuracy of signals. So work.
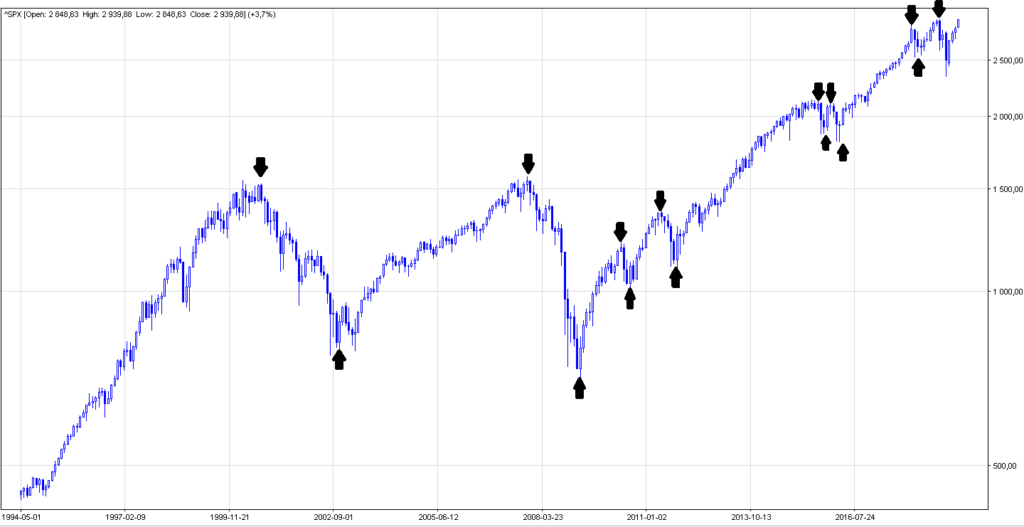
First, let’s choose historical market turning points based on the months as key units in the analysis – see chart No. 1.
Based on key data (month / year) from the past, we create the Carolan’s spiral calendar – table1.
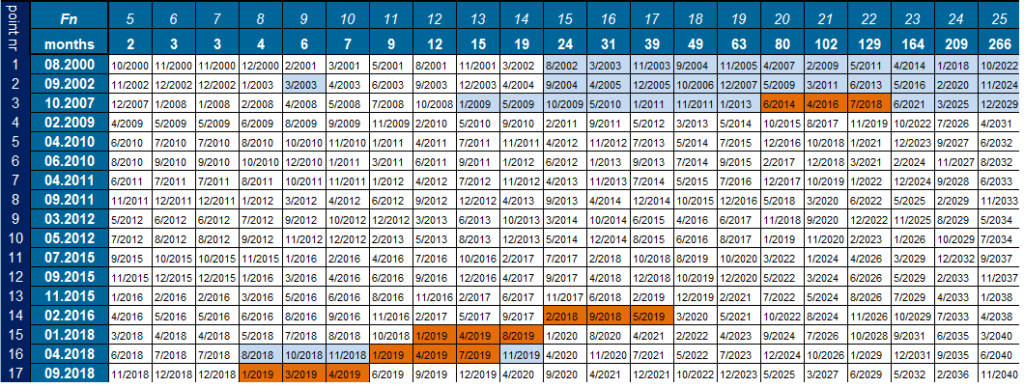
Legend:
Fn – is another expression of the fibonacci sequence; months- is the number of days past from the start date calculated with the fibonate numbers; dates highlighted in orange are dates meeting the golden ratio criterion for 2018/2019; dates highlighted in light-blue are the dates plotted on graph 2.
Chart 2 shows the dates of the American exchange, calculated on the basis of a spiral calendar. The historically oldest dates (the first from the table), ie 08.2000, were taken as the starting point. 09.2002 and 10.2007 (items 1, 2 and 3) and dates historically the youngest, i.e. dates 02.2016; 01.2018 and 04.2018 (items 14,15 and 16).
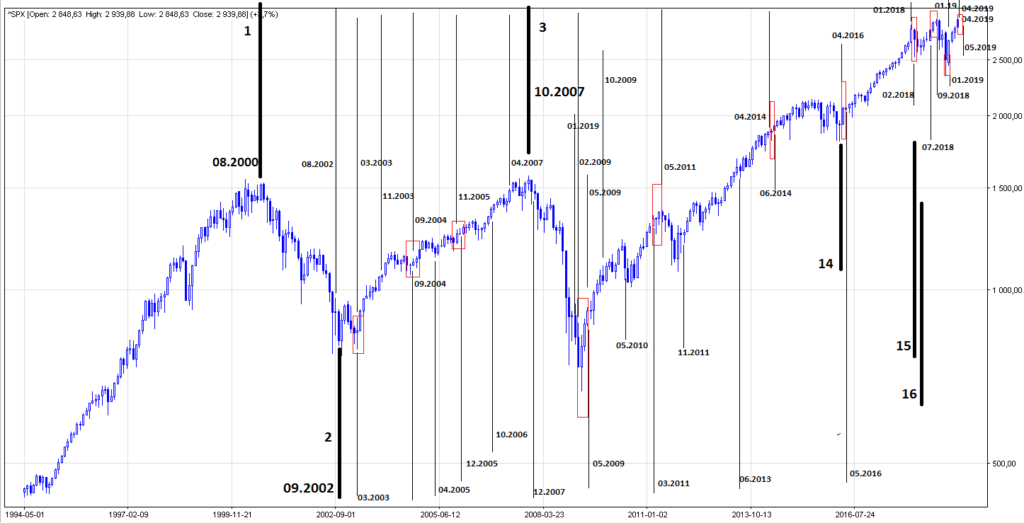
The following Carolan’s windows (red rectangles) were designated for points 1 and 2:
03.2003; 09.2004; 11-12.2005
For points 1,2 and 3, further Carolan’s windows have been designated:
02-05.2009; 03-05.2011; 04-06.2014; 4-05.2016
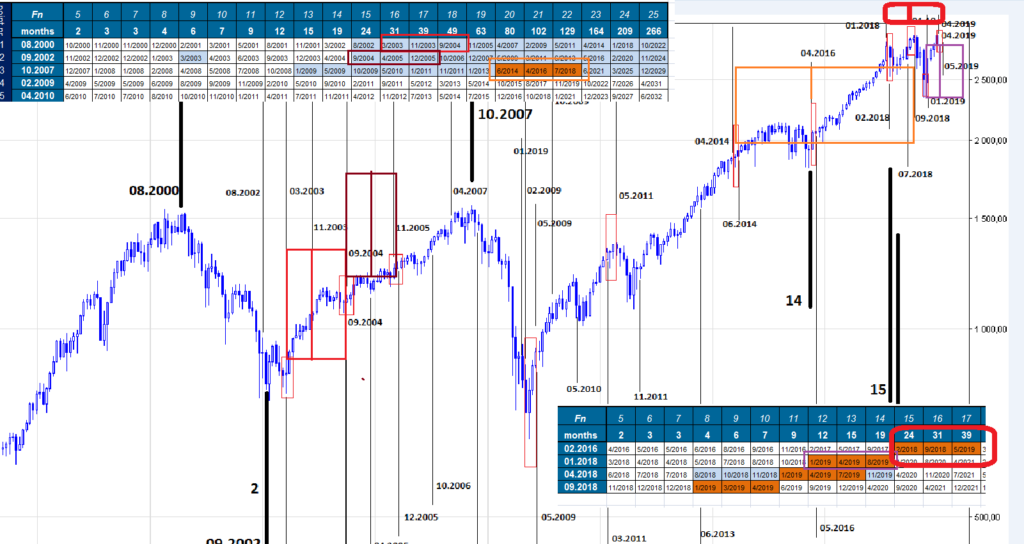
For points 1,2 and 3 and 14,15,16, further Carolan’s windows for 2018 – 2019 (1st half-year) were designated:
01-02.2018; 07-09.2018; 01.2019; 04-05.2019;
Fig. 3 presents a global picture of Carolan’s windows with the above-mentioned values and exemplified formations (rectangles) that meet the golden ratio conditions. Noteworthy is the division marked in red color created from the date 02.2016 and the division of purple formed from the date 01.2018. Their common part is a window in the period 04-05.2019, as a window peculiarly important from the point of view of the symmetry of the division. If the window works on the US Stock Exchange chart, we get a triple peak !. Note the change in the trend and the return of bears.