

DAX in a key place – ATTENTION for the return of bears !!! – Spiral calendar test !!!
Dear reader,
In this article you will learn that we are currently at a key moment on world stock exchanges – on the verge of a further “bull market” or the beginning of a dynamic correction of the current upward wave already on Western stock exchanges (USA, GER) from 03.2009 that is almost 10 years (increase of about 270%!). On the example of the German stock exchange index (dax futures “dy.f”) – we will make an analysis based on the traditional technical analysis of AT and also with the use of Carolan windows based on a spiral calendar generator.
Let’s start with generating a spiral calendar. For this purpose, we click on the link: https://newhach.eu/en/generator-of-carolan-spiral-calendar-lunar-calendar/and enter in the relevant fields of the form key index points of the index from 02.2000 – 02.2016 (Figure 1).
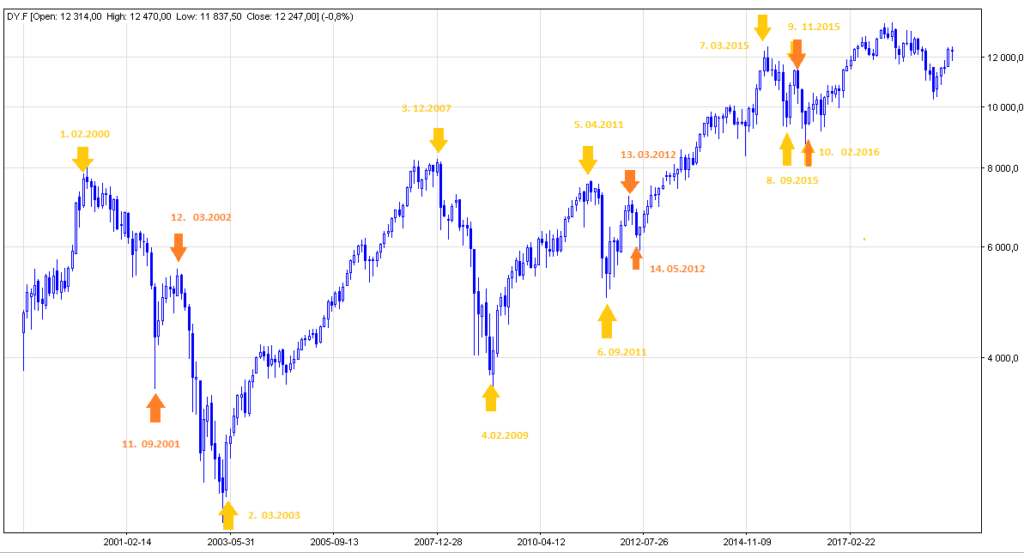
Yellow arrows are strong turning points of the index with high dynamics of movement – creating changes in the main trend, while orange arrows are changes in the index with moderate volatility constituting the correction movement in the main trend. Table # 1 shows the generated spiral calendar.
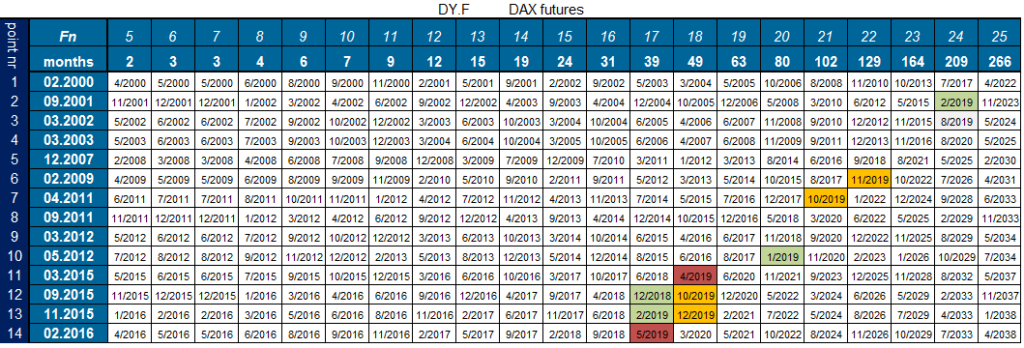
The Carolan window set for 2019 looks like:
1. beginning of the year: 12.2018 – 02.2019
2. 04 – 05. 2019
3. end of the year 10-12.2019
The set of dates April – May this year looks interesting. As you can see, we are currently in the Carolana! Window. Window dates are from: March. 2015 (peak) and February 2016 (bottom). Let’s look at the current situation of the DY.F index. The rate has so far reached the peak at closing prices in April at 12352pkt, while in May it breached it slightly and then dived on 06/05/2019 like the Niagara Falls, reaching a hole in the area of 11800pts. Will the April summit turn out to be the last peak before the dynamic wave decline? Based on the aforementioned theory and the behaviors of the twin stock exchanges, it can be said that there is a high probability that this is the case (see the article: https://newhach.eu/en/sp-500-index-analysis-based-on-carolans-spiral-calendar/
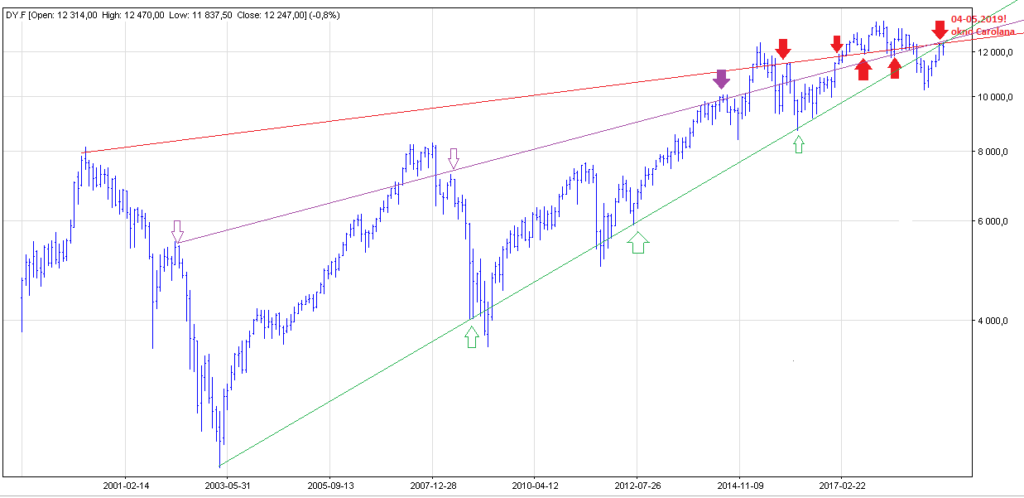
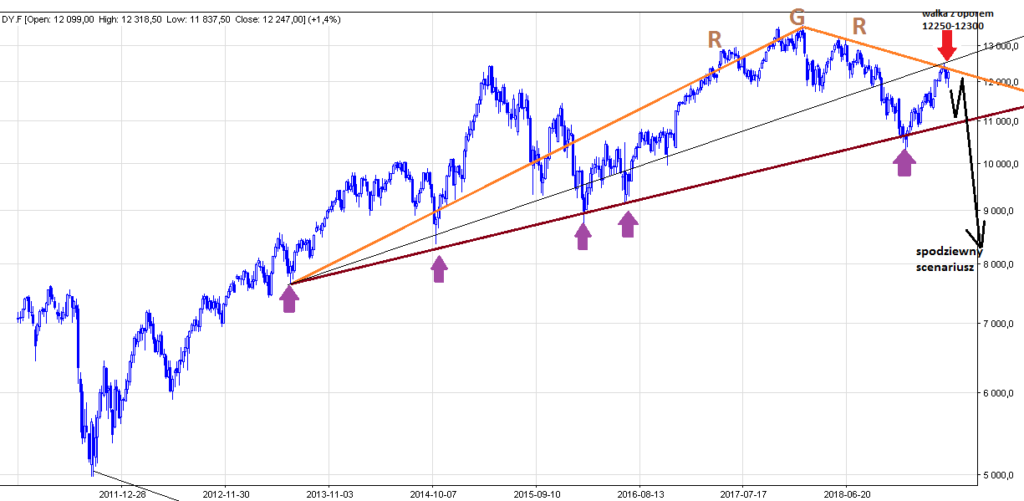
Now let’s look at the technical analysis of AT for our DY.F futures. Thus, in the graph of Fig. 2, three curves are shown, the focus of which falls in the present Carolin window in March-April 2014. Interestingly, the index chart looks like a typical “backside” under the right arm of the RGR formation that has previously been broken down (Fig. 3). In addition, as mentioned in the article https://newhach.eu/en/lunar-moon-calendar-implemented-on-dax-index/ , the course is currently fighting against the resistance of 12222 points, ie the day of the full moon during the Easter period. This level, as mentioned in the analysis, is key to maintaining growth.